Smart Sensors, Machine & Energy Monitoring
Increase Output.
Reduce Downtime & Waste.
Capture live data, OEE and energy usage right out of the box. Stop guessing at where potential problems are. Use real time data to empower your workforce with the hard facts needed to drive efficiency and immediate payback.
 OUTPUTIQ Monitoring › Energy Dashboard Ask AI DR
 The blind spot
You can't improve what you don't know or can't see.
- Energy
The heating gets turned up and stays turned up.
On a cold morning an operator is cold and the higher temp becomes the new normal.
- Schedule
A machine that should be running is not.
Planned in to run, nobody sees the issue until later in the day when the order is late.
- Downtime
A machine looks fine. A bearing is working loose.
Nothing on the surface shows there is an issue but the machine is close to failing.
- Downtime
The machine breaks down with no alert.
By the time anyone notices, 30 minutes go by before it is reported to Maintenance.
- Maintenance
Maintenance arrives but is blind to the issue.
No history, no trend, nothing to work from. Hours go into finding what the issue is.
- Energy
A machine is powered on but not running.
Not planned, powered and on, sitting idle and costing money, nobody notices.
- After hours
End of shift. Machines and lights left on.
Nobody is measuring it, so it happens again the next night, and the next.
- Weekend
You see weekend usage on your utility bill.
No activity planned, equipment is clearly drawing power but you have no idea what.
These look like separate problems. They share one cause: you cannot be everywhere at once, and you need a site or shop floor that is set up to tell you what is going on, so you can make real-time decisions that impact profitability and efficiency.
- 25%
- of the capacity you already pay for goes unused. Typical OEE sits near 60%, world class is 85%.
- 50%
- of manufacturers still track and plan their operations by hand, on paper or in spreadsheets.
- 20 to 40%
- of shop floor or site energy is burned by machines sitting idle, unseen on a single monthly bill.
Sources: OEE benchmarks, Lean Production and published industry OEE data. Manual tracking, Qlector 2025. Shop floor energy, Leanworx 2026. These are industry figures, not Output IQ measurements.
Transform your operation
From confusion to control.
Forget scattered paper, delayed reports, and hearsay. Stream live data directly from your machines & equipment for an instant, real time picture giving you total control.
ENERGYBusiness supply · account 88213-04
issued 14th
| Day units 18,240 kWh @ 13.5p | £2,462.40 |
| Night units 9,980 kWh @ 9.0p | £898.20 |
| Standing charge 31 days | £96.10 |
| Capacity charge | £412.00 |
| Subtotal | £3,868.70 |
| VAT @ 20% | £773.74 |
Maintenance — open
OUTPUTIQ Monitoring › Machine Monitoring Ask AI DR Your costly and frustrating blind spots can now be measured and controlled.
Precision energy monitoring
Measure your energy usage in real time. Pinpoint exactly what equipment is driving your consumption and the specific activity behind it. No more waiting a month for the utility bill to uncover expensive surprises.
Smart energy alerting
Set alerts up that matter to you, and let the system alert you in real time to real issues and anomalies. Get instant alerts when a machine draws too much energy, or is turned on when it should not be.
Energy intelligence
The part most sensor software misses. Output IQ understands your operation through parameters, algorithms and, with the ERP suite, live production detail. Every alert becomes relevant, real time, and worth acting on, so you cut waste instead of chasing noise.
Machine monitoring
Monitor machines in real time. Whether it is overheating, excess vibration, or an electrical fault, everything is surfaced live. It catches the problem before the breakdown, allowing TPM management, and handing maintenance vital problem solving information.
Smart controls
Some of our smart sensors don't just watch, they act. Once the system alerts you to equipment left running out of hours, or machines running dangerously, you have the ability to remotely isolate or turn off the machine, giving you both visibility and control.
Planning and production control
See the shop floor as it really runs. Spot the daily workarounds, the rework, and the machines running when they shouldn't be. It puts hidden inefficiencies right on the table so you can have the conversation with the facts in hand.
See what Output IQ can do for your operation.
Book a demoHow it works
Measure anything in minutes. Act instantly.
From machine information to utility usage and spikes, if you need to track it, there is a sensor for it. Go beyond just watching your data and start actively controlling your operation in real time.
-
 01
01Clip on and connect
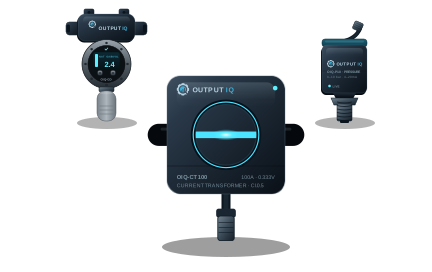
Most sensors clip straight on and go live in minutes. A few, like natural gas, need a proper install, but you will never face complex PLC work or heavy software. Just a clean, quick setup.
- 02
Streams live to Output IQ
Capture vibration, temperature, pressure and energy usage at any moment. Streaming over WiFi or 4G, it sends live data from any machine or equipment, of any age, from any manufacturer.
- LiveOut of Hours Cost£312Prev day£380↓ 17.9%Target£250↑ 24.8%03
Total visibility and control.
Track output, energy, downtime and utilisation by machine, cell or site. Get live alerts and take direct control exactly where you need it, inside the platform that runs your operation.
The sensor range
If it matters to your business, we can track it.
A versatile range of wireless sensors to monitor your machines, utilities, and the environment around them. Most clip straight on in seconds, a few require a standard install, and our active units give you control as well as visibility.
Electricity
Live kW draw by machine, equipment or circuit.
Clips onLive draw18.4 kWToday 1,840 kWh↓ 7.1%Out of hours £312Last nightVibration
Bearing wear, imbalance, misalignment and looseness.
Clips onTemperature
Overheating, cold chain and process drift.
Clips onHumidity
Ambient conditions for sensitive processes.
Clips onCompressed air
Flow, pressure and leaks across the air system.
FittedPressure
Hydraulic and pneumatic line pressure.
FittedNatural gas
Consumption, spikes and leak detection.
FittedWater and flow
Usage by line or process, plus leak detection.
FittedMachine bespoke
Cycles, idle time, run state or any custom signal.
FittedSmart sensors
Act as well as watch. Isolate or switch remotely.
FittedMore sensors
New types are added regularly. Tell us what you need to measure.
Ask us
The monitoring software is included on every tier. You pay for the hardware and the data.
See the full pricingThe honest comparison
Standalone capability. Seamlessly connected.
Standalone sensors just report disconnected noise. Built directly into your ERP, our monitoring uses live production context so every alert actively cuts waste. Get premium capability without minimum machine counts, annual lock ins or expensive add ons.
The catch
Don't be fooled by the headline price.
Entry plans advertise a rock bottom price, then leave out the exact features you need unless you upgrade to the max plan. Most of the time their headline price does not survive the final quote.
What the headline leaves out
- OEE reportingMiddle plan and up
- Real time alertingMiddle plan and up
- Sensors beyond electricalNot offered
- Fewer than eight machinesNot offered
- No device fee on topCharged extra
- Rolling monthlyTwelve month term
- Rent that ever endsPast the hardware value
- Help cutting the energy billNot included
The difference
They tell you the draw. We tell you so much more.
Standalone tools give you the reading and nothing else. Output IQ alerts against your own thresholds and algorithms, with the ERP underneath it, so that reading arrives tied to your own data, whether that is a job, an order, a machine, a factory or an operator, and you can act on it in real time.
OUTPUTIQ
- PRESS-04Out of hours11.4kW, 3h 46m02:14, 23 Jul
- CNC-04Unplanned run—13:40, 23 Jul
- OVEN-02Not ran—09:00, 23 Jul
- PRESS-02Spike21.4kW / 18.0kW11:07, 23 Jul
- COMP-01Spike4.8 / 2.8mm/s07:55, 23 Jul
- LINE-3Temp high84° / 70°15:12, 23 Jul
- PRESS-04Pressure high138% / 100%14:23, 22 Jul
- SHIFT-BDraw limit+12%06:00, 22 Jul
Standalone monitoring
- PRESS-04Live draw 11.4kW 14:20, 23 Jul
See how much it would cost to monitor your operation today.
Size it for your businessWho it's for
One feed. Every job in the building.
Sensor data does not stop at the machine. The same live signal becomes a different answer for each person who needs one, on the screen they already work from.
Owners and directors
Control your costs, cut downtime and know your true margin.
- Cut wasted utility spend out of hours
- Stop breakdowns before they cost time
- Improve your ESG and energy reporting
- Give your staff live data to fix problems
- Gain the productivity that live data brings
- See true profit by job, product, customer
Production
Full control of your shop floor in real time.
- Know when a planned job is not running
- Spot kit powered on but making nothing
- Catch machines run outside the plan
- See machines sitting idle mid shift
- Get live alerts on any unusual pattern
Operators
All the upside, none of the extra work.
- No extra work, and no threat to any job
- Most of the time nobody notices it is there
- Problems get seen without being reported
- Maintenance turns up knowing the fault
- Safer machines, because faults show early
Engineering
Efficiency from hard data, not guesswork.
- True process cost and time, from hard data
- Watch critical parameters as a process runs
- Root cause non conformance from real data
- Engineer out stoppages using long run data
- Find what works and repeat it on other lines
Maintenance
Catch it before it becomes a breakdown.
- Get real time alerts for every machine
- Watch critical readings live while you work
- Let readings drive TPM, not a calendar
- Service on real usage, not on fixed dates
- Root cause a breakdown from the readings
Quality
Evidence for every batch, not assumptions.
- Root cause a bad batch from its parameters
- Record key parameters live, no paperwork
- Investigate complaints on data, not guesses
- Get alerted the moment a parameter drifts
- Evidence for ISO 14001 and ESG reporting
Finance
Real costs now, not at month end.
- Allocate utility cost by machine, area or site
- Price jobs and products on what they cost
- See true costs now, not after month end
- Recover overheads on real machine hours
- Put a cost on downtime, scrap and rework
Sensors change how every department in your operation works.
Fitted with context
A reading means more when the whole system is behind it.
A basic sensor says your machine drew 14kW. Output IQ tells you the exact job, the real cost, and who needs to act. Standalone tools stop at the raw reading. Ours arrive completely wired into your operation.
Sensors in practice
Real savings, off real machines.
Plastics manufacturing
We installed a range of smart electrical sensors, vibration sensors and gas sensors to our equipment and machinery through Output IQ. With their support, controls and advice, the business has saved over 29% versus last year on Gas and 17% on electricity with more to come. Total savings in year one are projected to be around £62k.
Sensor questions
What people ask before fitting anything.
Does it work on older machines?
Yes. The sensor reads the machine's power signal, so age, make and model don't matter. If it draws current, it can be monitored. No PLC integration needed.
How long does fitting take?
Clip on sensors take minutes per machine and need a power supply and a connection, nothing more. Fitted sensors take longer and we will tell you which of your machines need one before you order anything.
Does fitting interrupt production?
Clip on sensors go around the existing supply cable without disconnecting anything, so most machines carry on running. Anything that does need a stop is flagged in advance so it can be planned into a gap.
Do we need new IT infrastructure?
No. The sensors report over your existing network and the platform is cloud based, so there is no server to buy and nothing to install on a PC. If part of your site has no coverage, tell us and we will work around it.
What can you actually measure?
Current draw and energy, vibration, temperature, pressure, humidity and run hours, depending on the sensor. The range grows. If something matters to you and we cannot measure it yet, we will say so rather than promise it.
What happens if the connection drops?
Readings buffer at the sensor and upload when the link returns, so a dropout costs you a delay rather than a hole in the record.
Do the sensors need calibrating?
Not routinely for the monitoring and trending most people use them for. Where a reading has to stand up to an audit or a customer specification, tell us what standard applies and we will be straight with you about what we can and cannot certify.
Will they survive our environment?
Tell us the conditions. Washdown, heat, dust and hazardous atmospheres all need a sensor rated for them, and we would rather turn a job down than fit something that fails in six months and leaves you with no data.
Will the energy figures reconcile with our bill?
The site total will reconcile. The difference is that the split across machines, areas and jobs comes from measurement at each asset rather than from an apportionment somebody worked out in a spreadsheet.
Do I have to buy the hardware?
No. Buy a sensor outright or rent it per machine per month. Renting keeps it out of capex, buying is cheaper over time, and you can mix the two across a site.
Is the monitoring software an add-on?
No. It's included on every tier. Only the hardware and a small per sensor data fee scale with sensors.
Can it alert us automatically?
Yes. Set thresholds per machine and per reading, and alerts go to the floor, to a manager, or to both, as the limit is crossed rather than at the end of a shift.
Do operators have to do anything?
Almost nothing. The machine reports itself. The only interaction is confirming a reason when a machine has already stopped, and the reasons are a list your own people write.
Where does the data live and who can see it?
UK hosted with Fasthosts, in your own database rather than a shared one, with daily backups kept for thirty days. Access is by role, and if you ever leave you export your data and take it with you.
How is this different from a standalone monitoring tool?
The capability is similar; the difference is where the data lives, in the same system as your jobs, stock and costing, with no second system to run or pay for.
Still unsure? For straight answers, not a sales pitch. Book a demo